Thursday 22nd January 2026

It’s been a long time coming, but just before Christmas, the DfT published the final report evaluating the effectiveness of its £19.4 million Rural Mobility Fund.
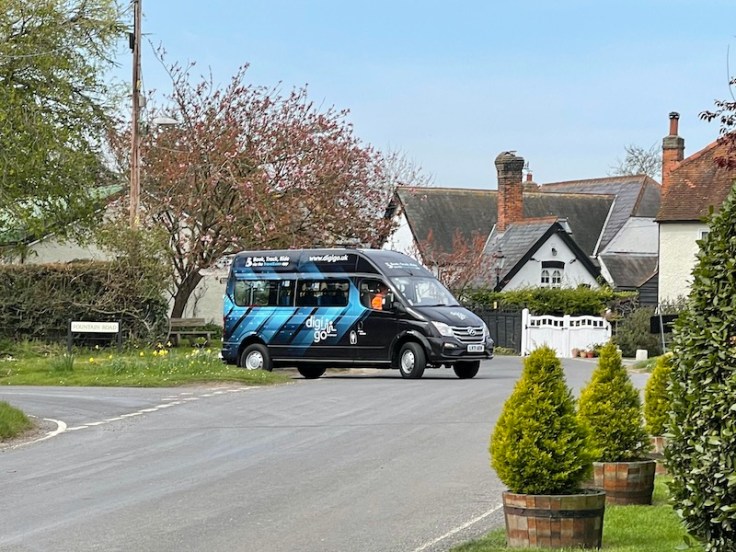
That Fund, launched in March 2021, spearheaded 19 DRT schemes in 15 Local Authority areas across England each funded for a two to four year period and many of which have subsequently continued with Bus Service Improvement Plan funds. An Interim Report was published in October 2023 but by then only seven schemes had got going and some of those were still in their infancy leading to fascinating results including Essex’s DigiGo scheme carrying the grand total of 0.14 passengers per hour.
This Final Report, dated September 2025, covers all 18 of the 19 intended schemes with one, in Cumberland and Westmorland & Furness, yet to start. It’s been compiled by a consortium holding a contract for the DfT for “Provision of Evaluation Research Support for Local and Regional Transport Analysis” which includes the University of Westminster and University of the West of England and provides an extensive review of each scheme. Despite the length of time that’s elapsed the analysis is based on data only up to September 2024. Nevertheless it paints an interesting picture of how DRT performs after a much more scientific and objective analysis than my sporadic random journey experiences over the last few years can ever achieve.
This Final Report is described as phase 1 with a phase 2 promised as a follow up which “is being conducted separately and will undertake impact and value for money evaluation to supplement the findings of phase 1 with a more in-depth assessment of the outcomes and impacts of the pilot schemes.”
There’s a myriad of tables and graphs in the Report with the most relevant setting out numbers of passengers using each service, revenue, and utilisation of vehicles, especially as in many cases these results are after two, three or more years operation, although the Report does make the point numbers are improving over that time in a number of cases while others have levelled off.
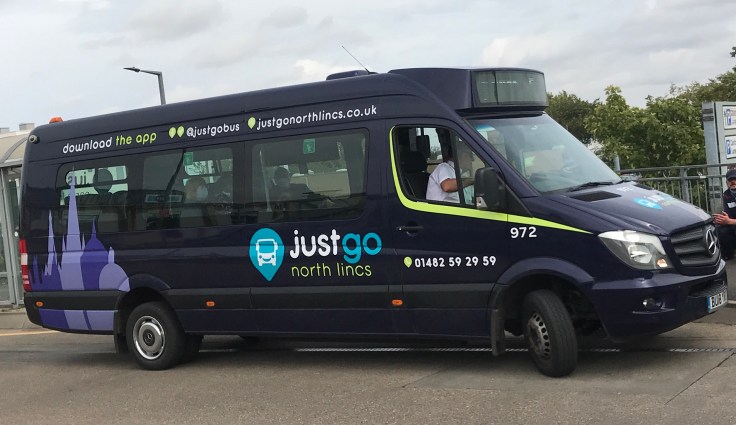
There’s a wide variety of schemes analysed ranging in geographic size from four square miles (Mansfield) to 337 square miles (North Lincolnshire); from schemes involving one minibus (North Cotswolds and Swaffham, Norfolk) to others involving six (High Wycombe and north west of Chelmsford). Altogether 55 minibuses have been involved. Interestingly the average percentage of journeys made with concessionary fares across the 18 schemes was the same (26%) as for local bus services in English non-metropolitan areas.
Overall, 87% of journeys were booked using mobile apps with phone bookings on 11% and the small balance on websites.
Ignoring North Lincolnshire which was an outlier, the average advance booking time was 2.7 days with longer lead times typically associated with concessionary fare journeys and phone bookings indicating an important user base of the services being less happy using technology to book their travel.
Here’s a summary of the 19 schemes, with their Rural Mobility Award amount, duration and start date.
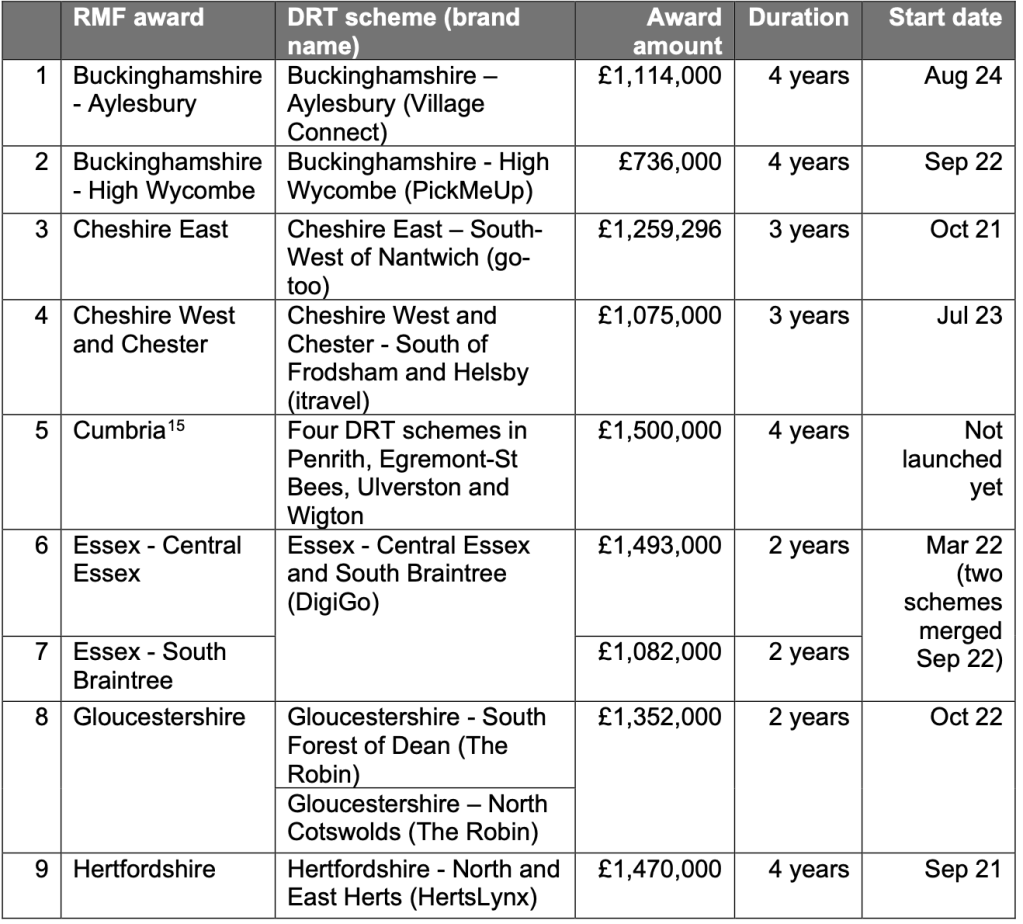
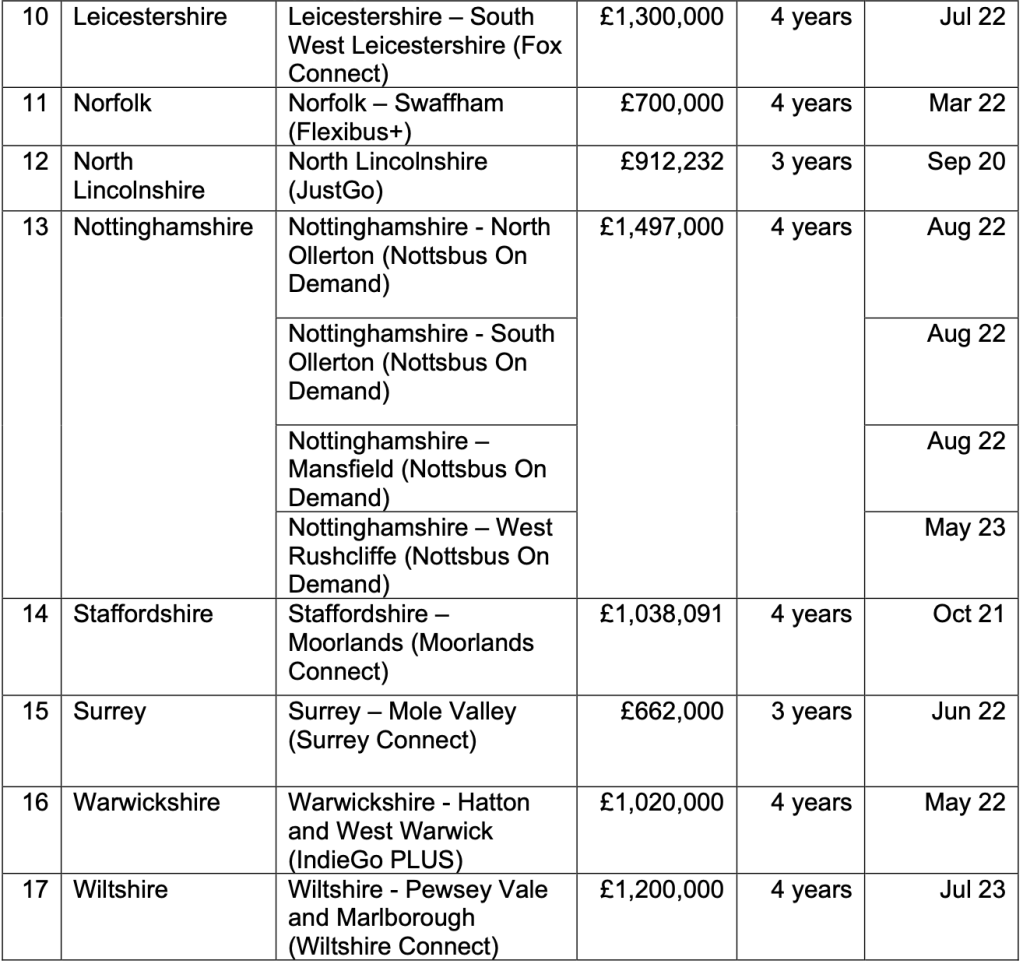
After that preamble, here are the results.
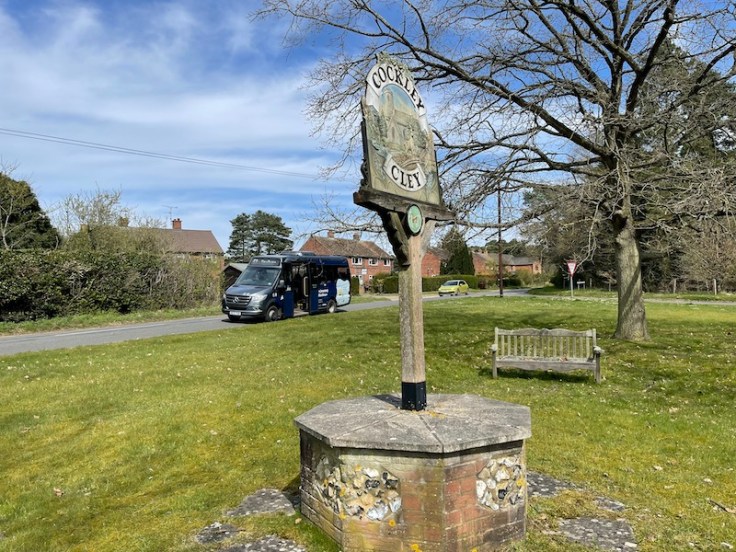
Passengers
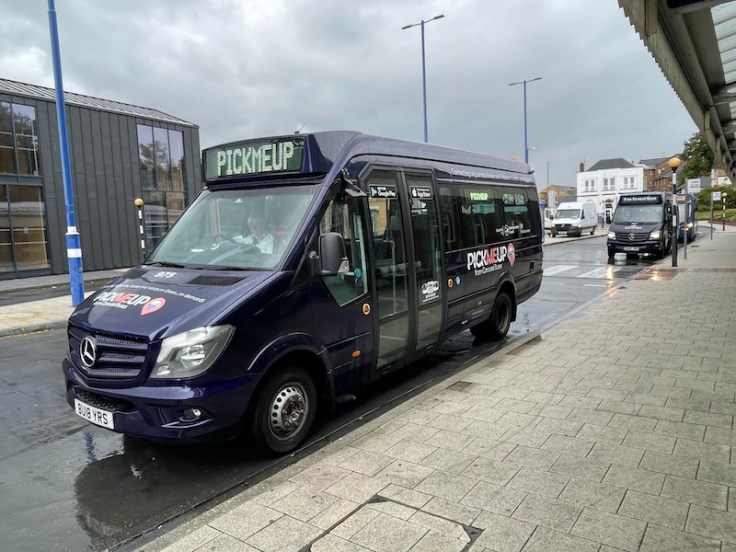
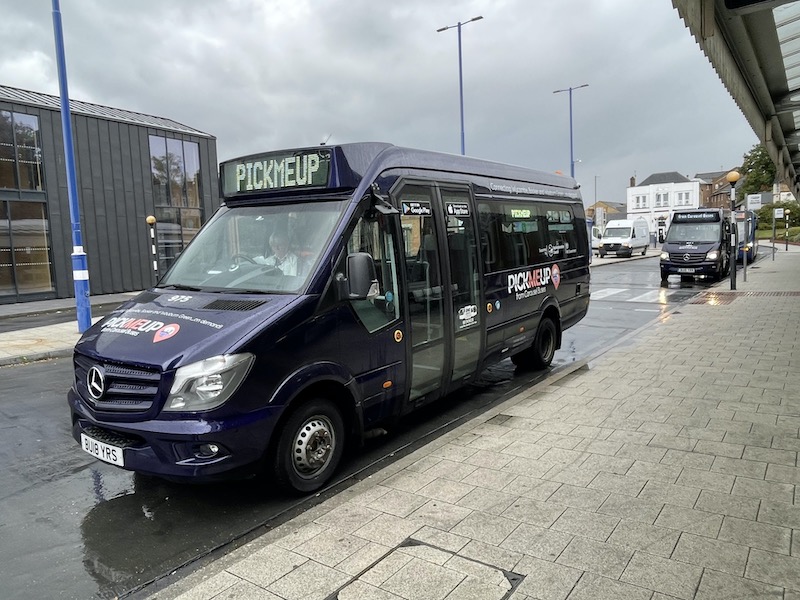
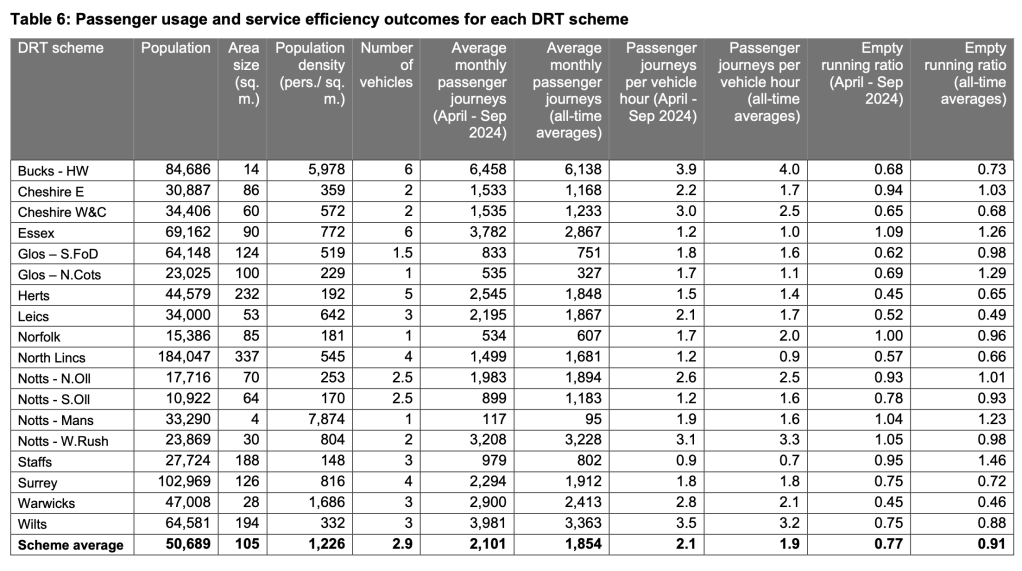
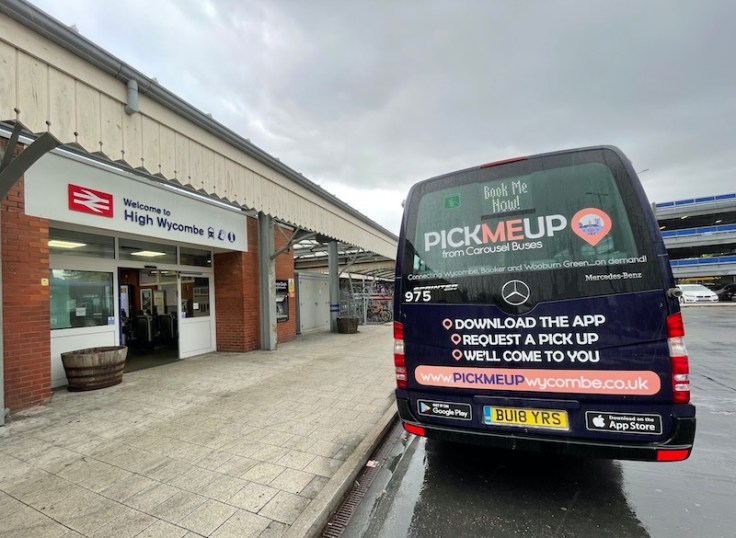
The most used scheme of the 18 is Buckinghamshire’s PickMeUp in High Wycombe with 3.9 passenger journeys per vehicle hour for the latest reporting period (six months to September 2024) with the Staffordshire scheme in the rural area north of Ashbourne the least used at 0.9 passengers per hour. Nine schemes managed between one and two passenger journeys per hour with five between two and three, and three (Cheshire West and Chester, Nottinghamshire’s West Rushcliffe and Wiltshire) achieving between three and three and a half passengers per hour.
Revenue
Revenue per passenger is slightly complicated by eight schemes being within the £2 fare cap and others not. For the whole Rural Mobility Fund period up to September 2024 total revenue from 823,490 passengers was £1,654,530 representing £2.01 per journey. The Report makes the point “if the £2 fare cap was not in place, fares would have been higher, which could increase revenue per journey, but may have reduced the number of journeys taken.”

Unfortunately the Report doesn’t include any information about operating costs for the schemes, which is a rather unfortunate omission, which in my judgement makes for a somewhat incomplete evaluation. Perhaps that will follow in phase two when value for money is considered, but for now, if we divide the £19.4 million Rural Mobility Fund by the 823,490 passengers who travelled up to September 2024 it gives a subsidy of £23.55 per passenger journey.
Vehicle utilisation
One of the challenges of DRT schemes is to minimise empty running between passengers being dropped off and wherever the next pick up is located. This is particularly pertinent to schemes across a wide geographic area. The Report sets out an “empty running ratio” for each scheme ranging from 0.45 to 1.09 with a mean value of 0.77 indicating 77 miles are driven empty for every 100 miles with a passenger on board. Four schemes (Essex, Norfolk and Nottinghamshire’s Mansfield and West Rushcliffe) have ratios of 1.0 or higher indicating more miles are run without passengers than with passengers. The 0.45 lowest ratio was achieved by Hertfordshire and Warwickshire with Leicestershire just above on 0.52 and North Lincolnshire on 0.57 which isn’t bad as it’s also the largest geographical area covered.
Unfulfilled bookings
Another key metric, and one I’ve found personally exasperating over the years, is what’s called “unfulfilled bookings” – both passengers being unable to book a journey to meet their travel needs (as a bus isn’t available) and booked passengers failing to turn up for the journey. The Report notes “the relative number of unfulfilled bookings compared to fulfilled bookings is an indicator of the capacity of the DRT service to meet demand and of the service experience of users”. Local Authorities were asked to give a breakdown of unfulfilled bookings by reason but it proved challenging to collect such data due to it being held in different ways across different technology platforms.
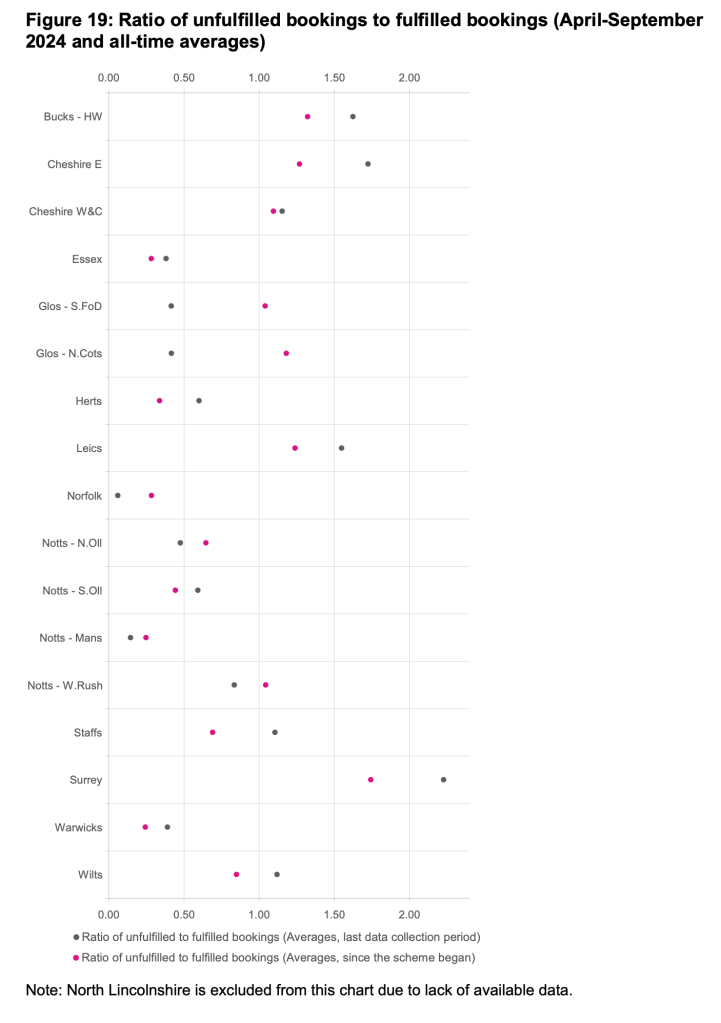
Notwithstanding that limitation, the Report includes a ratio of unfulfilled bookings to fulfilled bookings across the schemes – a low ratio indicated a higher proportion of bookings being fulfilled, a high ratio indicates a high proportion being unfulfilled. For the latest data collection period (six months to September 2024) Surrey tops the unfulfilled chart with a ratio around 2.2 (the Report doesn’t give precise results and only displays them in a chart) indicating for every journey successfully made, more than double that number were unable to be accommodated and passengers left frustrated. The data shows in Surrey’s case 82% of the 31,140 unfulfilled bookings were for no service or vehicle being available, 15% the passenger cancelling and 3% cancelled by the provider. All in all a somewhat unsatisfactory state of affairs.
High Wycombe, Cheshire East, Cheshire West and Chester, Leicestershire, Staffordshire and Wiltshire all had ratios above 1.0 indicating more passengers turned away than being carried with Hertfordshire, and Nottinghamshire’s South Ollerton and West Rushcliffe between 0.5 and 1.0 and the other seven schemes between zero and 0.5.
Here are a couple of the Report’s tables giving more detail of passengers journeys per hour and empty running ratios for each scheme…
… and the ratio of unfulfilled to fulfilled bookings for both the latest reporting period (blue dots) and experience to date (red dots).
Among the Report’s conclusions are…
The Rural Mobility Fund (RMF) pilots have been perceived as successful by the Local Authorities (LAs). This is generally due to the pilots providing an enhanced level of public transport access in the areas they serve. For some LAs the pilot has also provided an opportunity to trial a transport solution that is new to them or would not be feasible without RMF funding. The pilots meant LAs were able to demonstrate to the public and local stakeholders what DRT is and how it can work in practice in their local areas.
….and, crucially ….
LAs and partners involved in the process evaluation felt that there are inherent tensions operationally between maximising revenue, maximising passenger numbers and maximising access to services. It was accepted that the numbers of passengers carried on DRT services in the pilot areas would be unlikely to cover operating costs from ticket income alone. Whilst the level of subsidy might vary between schemes, the aspiration in the longer term was to achieve at least equivalence with fixed route bus contracts.
My conclusion would be this Report shows very clearly that aspiration will always be elusive.
And for evidence of that, you need look no further than Cambridgeshire & Peterborough Combined Authority’s dalliance with its TigerOnDemand schemes set up with BSIP funding with the latest update provided to last week’s Transport Committee confirming the South Cambridgeshire T10 scheme…
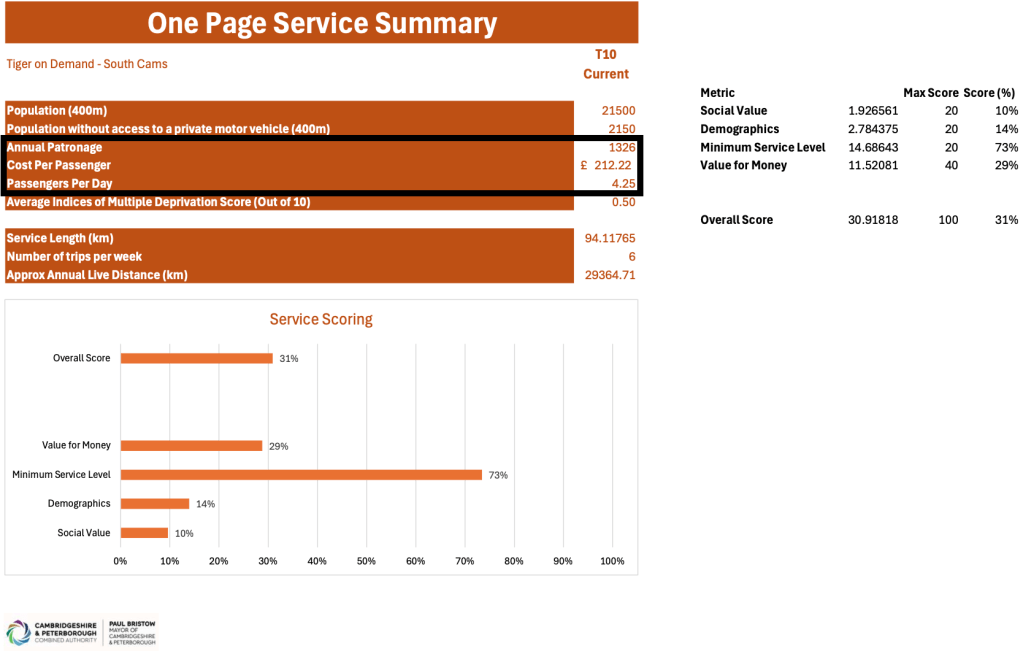
… has a subsidy of £212.22 per passenger journey and sees only 4.25 passenger journeys per day.
Probably just two people travelling out and back, with an occasional third taking a ride.
Roger French
Blogging timetable: 06:00 TThS

Presumably the cost of this report – and its future instalment – are more money poured down the DRT drain. I wonder if a better use of it might have been to subsidise a few councillors in each case actually using the DRT services, talking to the drivers and any other users they chanced to come across, and reporting back to a council meeting
LikeLiked by 2 people
explain the t10, if that is two regulars are the destinations and times the same, could they be covered by a fixed route. Is it planned to check awareness in low use areas of service and readeons for not using it?
JBC Prestatyn
LikeLike
Sorry Surrey is interesting, with stats like that would indicate management action needed like look at lost journeys for desire paths and also success ones and map to existing network of fixed routes . O also recall the days of Peterbus which also had varied take up with some frustrations in that. Did Mole Valley coaches cover the area in the past, I think they used Karrjer welfare type buses on three fixed routes in North East Surrey.
JBC Prestatyn
LikeLiked by 1 person
is it time to review the transport excluded wider fir provision. London and I think Leeds have dial a ride for disabled to access social or trips to work, but the general public are excluded in part due to comprehensive other public transport. Now if we merge say in Cambridgeshire a dial a ride based on disabled users anywhere in the county with anyone in an origination or destination to somewhere in excess of 1km safe walking to a regular transport route
JBC Prestatyn
LikeLike
The closest I ever got to using a DRT service was Rutland’s ‘callconnect’, but it turns out that this doesn’t operate on Sundays (the only day when there are also no regular buses available). If it is just a subsidised taxi service, it would make sense to offer it at least at times when people are forced to use taxis due to the lack of alternative public transport.
LikeLiked by 2 people
It would be interesting to see an analysis of the effectiveness of the allocation software. Are they all using exactly the same principles for trip allocation? Do they involve any feedback or dialogue? By the latter I mean contacting the bookers, both those already accepted and potential ones to see if there’s flexibility in their trip requirements (time and destination).
Outside of that, is there any evidence of groups of passengers cooperating to simply make it possible for more to travel on the DRT?
Are there local DRT Users’ clubs?
For the whole concept to maximise effectiveness it strikes me that a high level of user participation in its day to day runner Ng is essential.
Treating DRT simply as an independent taxi service with minimal resources seems to me to be a recipe for guaranteed failure.
LikeLiked by 1 person
I’m replying to myself here as more and more thoughts arise. Given that the average pre-booking period is 2 days or more, there’s great scope for the operator to make publicly available the journeys that are already fixed for the next few days.
If potential short notice passengers could actually see what the bus will be doing on a particular day, and to see how many seats are available, then they might be able to fit in with that. A bit like a scheduled bus service but with a varying (but publicly visible) timetable.
LikeLiked by 2 people
“Outside of that, is there any evidence of groups of passengers cooperating to simply make it possible for more to travel on the DRT?”
That, surely, is what the DRT software should be doing without the need for passengers or operators to have to do it manually?
RC169
LikeLike
Perhaps the problem is that customers have to make a series of booking requests for different departure times in order to get a journey, without being able to see when the minibus is available on other journeys booked from the same area just outside their own booking ‘window’. This is very similar to removing timetables for fixed services from a website and insisting everyone uses a journey planner. The result is that customers are deterred from using the service just because there isn’t a journey when they happen to enquire, whereas if they are able to see what’s available (ie a timetable) they may be able to adjust their travel plans to fit.
LikeLiked by 1 person
Booking software should offer alternative times if the time the request came is not available.
LikeLike
Interesting blog, as ever, thanks Roger. One metric I’d be very interested in, but one which I doubt any booking system is configured to record, is the number of cases where a passenger was carried on their outward journey but then left stranded when unable to book the return trip later that day. Do such stats exist? It seems to me that the possibility of stranded is one of the significant reasons that undermine confidence in DRT schemes.
Richard Delahoy, Southend on Sea (where there are no DRT schemes, thankfully)
LikeLiked by 2 people
As Richard D. knows, I live in the Braintree area of Essex, covered by the expanded Digigo service. The issue of a return journey not being available is definitely a problem according to friends using the service. This has led on occasions to my friend either cancelling the outward journey or walking the two miles home across the fields from the nearest conventional bus route. I can’t comment directly on the Digigo service because I am one of the five per cent of the population that Essex County Council have banned from using the service.
In the Digigo area a couple of independent councillors are trying to set up a users group. Unfortunately even they have hit a brick wall when trying to extract operational information from Essex County Council.
Nigel Turner
LikeLike
Why have you been banned from using the service by Essex County Council?
LikeLike
My observation is that this report looks at the operation of DRT from a Council’s perspective, rather than from a users persoective. Did the report ask users for their views, why did they travel, what did they do before DRT was introduced, did it meet their needs, would they use it again etc etc
MotCO
LikeLiked by 2 people
The report focuses on the costs but in the form presented on this blog doesn’t appear to comment on the social benefit. Having used the Nottinghamshire scheme and talking with passengers it’s clear that the service is invaluable to them. For Nottinghamshire, DRT is just one of the pieces in a county-wide public transport provision. Passengers commented that using a ‘normal’ bus offers them a level of dignity that the erstwhile social services-adapted minibuses didn’t offer. It’s easy to criticise DRT in terms of cost per person, but the benefit to that person shouldn’t be overlooked. Of course, a private taxi might do the job just as well, but then that negates the county council’s wish to provide public transport options for as wide a cohort as possible.
LikeLike
In Dorset we have DCT’s “PlusBus” which seems to be well used and cost-effective by virtue of being to fixed destinations (ie a town with shops) on certain days only. You need to pre-register and pick ups are within a designated (rural) area. DCT says: “We do not receive any direct subsidy for our PlusBus service – we provide it as part of our charitable objectives and public benefit to help improve transport opportunities to individuals within the community. Dorset Council supports the service by enabling the use of National Bus Passes and project funding to improve services and trial new routes.” – Tony Smale
LikeLike
Which is all great until you try and use it if you’re not a local resident.
Computer says no.
Leisure travel, particularly for walking, away from the coast in Dorset is really difficult.
LikeLike
Agreed, but this type of CT for “members” only on regular runs is probably the only type that is going to be understood by the general public and sustainable over a long period.
LikeLike
Surely the PlusBus name has already been taken by some national rail outfit?
LikeLike
Yes, a stupid choice of branding.
LikeLike
As always a useful bit of analysis of a report that is focused on providers rather than users.
One thing not mentioned is whether the DRT schemes were additions to the network or are replacements for withdrawn local bus contracts. Here in Notts the schemes that replaced fixed routes (N Ollerton, S Ollerton, W Rushcliffe) appear to provide a good service. However, the Mansfield evening scheme was an addition – there having been no evening buses in the areas covered for sometime.
As always though, the failure of the Mansfield evening scheme is largely because of a depressed local economy meaning no demand. The majority only travel for a reason, no reason no travel. Unless someone revives the evening economy the buses will remain empty.
Richard Warwick
LikeLike
Roger.
It would be very useful to have comparative figures for these relatively new BSIP funded schemes against a long established scheme such as Lincolnshire‘s Call Connect.
Peter
LikeLiked by 1 person
Yes, and against one-to-many / semi-DRT schemes such as Compass Bus Route 99 which has now been running for years and years
LikeLike
Why can’t we have subsidised taxis that charge bus fares/ accept concessions instead? Surely it would be cheaper for the council, provide more stable income for the driver and be more widely available/ accessible for potential passengers. In areas where fixed bus routes are genuinely not viable, either all day or for part of the day/ week, shared 7 seater taxis or smaller minibuses should be the norm. Shared taxi rides between strangers should be the norm anyway.
Could be useful in more suburban areas too, where often the mile or 2 between the rail station and home is more of a barrier to going out but lower density means buses won’t run without subsidy.
Aaron
LikeLike
Shared taxis was part of the rural bus “solution” in Devon for very many years …. a service was offered at specific times on several (but not all) days of the week.
It was necessary to prebook the day before so that the correct size of car/ minivan could be provided …. these ran at bus fares and accepted ENCTS passes.
They are slowly dying off now … I suspect because the clientele are dying off!!
I see no reason why such a shared taxi couldn’t be provided at stations for the last mile home …. but the morning commute would, again, require pre-booking to ensure a large enough vehicle to be provided.
The problem, I suspect, is that a taxi license is not the same as a bus … and the concept has simply been put into the “too-difficult” pile because of that.
So, Aaron (and this us a serious suggestion for you to follow up on), ask your local Councillor to speak with Herts CC to set something up at Cheshunt Station and Waltham Cross for a 6-month trial. You never know ….
LikeLike
That’s interesting to hear it was tried in Devon. I don’t really know if it’s possible but would consider councils just contracting local cab offices and employing drivers directly, with the existing catchment areas of the cab offices being used. For it to be a success, boundaries can’t be strict. One of the major issues with DRT is limiting journeys to within a zone in a county, which only creates more issues than it solves.
Given that Cheshunt is urban/ suburban, not sure if it’s a good solution here, a town route every half hour serving residential areas, the high street and station would be more appropriate. Smaller places like Cuffley and Goff’s Oak and villages like it, a shared taxi makes more sense. If it were tried, a year trial would be more ideal. What is really annoying about Cheshunt Station area, is a bus was supposed to come with the housing development and the development stalled, with the council doing bugger all about it despite high local housing demand.
Aaron
LikeLike
licencing for bus taxi and phv is a mess. There should be one system for vehicle maintenance and one nationwide for drivers under a scene similar to security industry. A local knowledge test where a local authority wants that and a safeguarding dba check for drivers and passenger assistants. Operators licenced on running vehicles up to 5 passenger, 12 , and 16 fir smaller sized entities and thereafter any bus. Holding a higher rank covers any below so bus operators can run accessible taxis if they wish.
LikeLike
Passengers per vehicle hour doesn’t necessarily tell the whole story – passenger miles per vehicle hour would be an interesting one. The High Wycombe scheme appears to have very high utilisation, but if it’s operating within a town where most people are only going to be travelling for maybe 10 minutes or so, so each vehicle can fulfill several passenger journeys per hour even without people sharing rides and still being empty for half the time – whereas in sparse rural areas, a single journey might be more than half an hour so you’re never going to get such a high number of passengers using it but that doesn’t mean it isn’t being as well used.
LikeLike
How many different software platforms are in use for these services, and are any of the statistics analysed “per platform”? This might show if the platforms are all more or less equal, or if any is consistently at the high or low end of a particular metric (e.g. which is good for requests fulfilled, or bad for proportion of dead running, or ….).
LikeLike
what does not seem to be mentioned is how awful the various booking systems are. For example I want to go from A to B at 10.00 am, but the bus is on another journey. But there might be another booking at say 0940 or 1020 from A to B that would have been ok for me, but the system does not tell me that. The App providers have a lot to answer for and the Dft should have developed a proper booking system for all the schemes before wasting £20m.
What does this report tell us? There are lots of statistics but it comes to no conclusions nor really gives authorities a blueprint of how to operate a least useless DRT.
And the most damning legacy is that most authorities, having started these services, now feel they must continue them using up valuable BSIP funds that in most cases could have been put to better use.
LikeLike
WESTMORLAND – Welcome to Westmorland and Furness | Westmorland and Furness Council
LikeLiked by 2 people
Corrected, thanks.
LikeLike
I think the real test of how successful these DRT services are is how many remain in 5 years time.
My personal guess is not many.
LikeLike
All that money chasing so few passengers – a disgraceful waste of public money!
LikeLike
This is so frustrating for sheduled community transport services who are by contrast starved of funds.
LikeLike
Thanks Roger, this is really interesting and useful!
LikeLike
I get the Councils are trying to do something about Rural Areas being void of public transport. As the main Groups seem to have this idea that anyone living in a village is unworthy of a bus. However for example in Leicestershire they have to be booked days in advance and if there are not enough people wanting the same destination. The Service does not run. Which in respect is sensible in terms of the cost of fuel. I would like to ask was Rural Transport better before de-regulation
LikeLike
Comment from John….
The proportion of requests being declined is horrendous.
It makes DRT totally unsuitable for the most important use-cases for public transport.
No good for health appointments – when you are offered a choice of dates 6+ weeks ahead, you can’t say “Can I let you know a week ahead when I find out when DRT can offer me a ride?”
No good for employment. To hold down a job, you need a service with 99.5%+ reliability. (If you need to make 20 return journeys a month, that is 40 trips, and you have a 19% chance of at least one failure even if each trip is 99.5% reliable).
Similarly, no good for education.
Not much good for onward travel if that requires advance booking. By the time you know that you have a DRT ride, you may only have the most expensive tickets left for your rail/coach element. And if you are going away for more than a week, you won’t know about your success in fixing a return itinerary before you leave.
It leaves DRT as useful only for discretionary travel – where it may be a nuisance not to get a ride, but not a big problem. Social contact may fit this (but not if you were going to something that needs advance booking). Shopping fits this – with the caveat that with home delivery available even in many deeply rural areas, the need is much reduced.
Susbidised taxis are probably the least-bad solution in sparse-demand areas. But if the budget isn’t to be blown within weeks, it needs politicians to decide who gets the subsidy, and for what purposes.
And it needs collaboration between District councils (who manage taxis) and County councils (who manage buses and the subsidy funding). Moving to unitary authorities (as proposed in the Local Government Reorganisation proposals currently out for consultation) would make this easier.
LikeLike