
Tuesday 28th April 2020
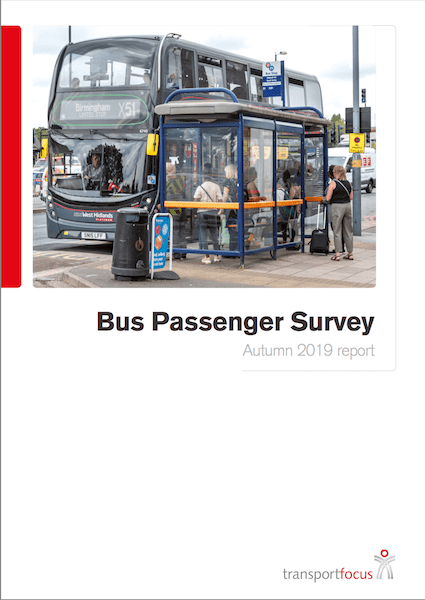
Back in Lockdown Week 1 at the end of March (remember that?) Transport Focus published the results of its annual Bus Passenger Survey. The trade press was by then busy furloughing so the report didn’t receive its usual extemsive coverage. Nor was it appropriate for bus companies to give their usual massive shout out about the great results they’d achieved while at the same time telling us not to travel on their bus services unless absolutely essential.
So fate has meant this year’s survey report has slipped out pretty much unnoticed. I decided to take a look at the findings to see if there’s anything we can learn to help prepare for the upcoming ‘new normal’.
This is the tenth annual survey of bus passenger satisfaction arranged by Transport Focus and each year it’s grown in size thanks to some bus companies (notably the Go-Ahead Group, part of Stagecoach, Blackpool, Reading and Warrington and First South Coast) and a myriad of local authorities funding extra survey responses in their areas to supplement the rolling programme Transport Focus’s fairly modest budget accommodates around the country.
It’s a sizeable survey. This year 43,872 bus passengers took part across England (outside London); the largest response since the first survey in 2009. Another 2,399 passengers were surveyed in Scotland thanks to funding from Stagecoach and Aberdeen’s transport body (‘nestrans’).
Fieldwork for the survey was undertaken in very much a pre-Covid-19 world last Autumn between 8th September and 21st December 2019 but avoiding the school half term. Surveyors travelled on buses handing out questionnaires with a reply-paid envelope or a link to an on-line survey. Passengers rank their experience of that journey across a range of factors including time waited at the bus stop, issues on board the bus, value for money, driver performance and a host of other matters.
Clever weighting of the results provides a representative picture of passenger journeys in each sampling area including age and gender of the respondent and time of day of the journey as well as the relative number of passengers in each town compared to another.
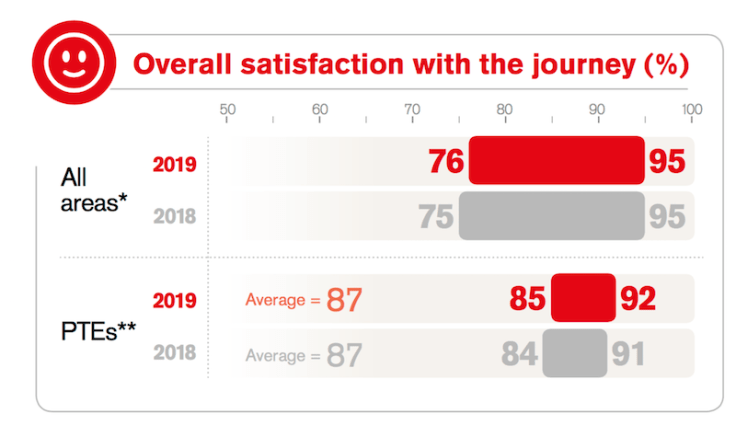
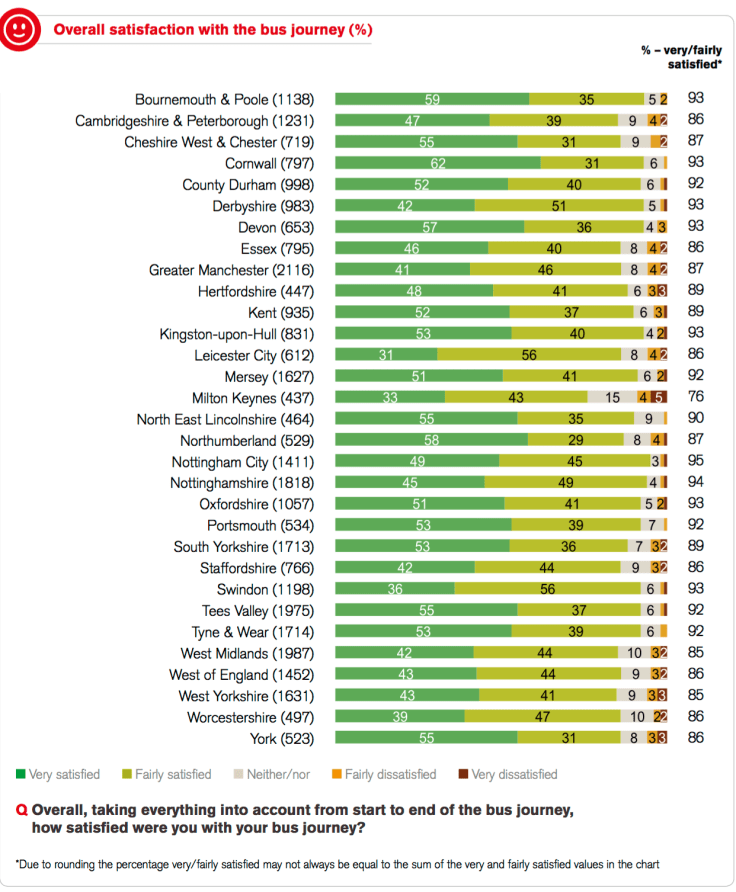
This year’s headline result was overall bus passenger satisfaction of 89% (unchanged from the previous year) – the range around the country being between 76% and 95% (up slightly from a 75% to 95% range last time). I’ll take a look at the chart toppers shortly but before that my usual observation about the definition of ‘satisfaction’.
Impressive as the 89% result is, it comes from adding those who answered questions/statements as “very satisfied” together with those who reckon they’re “fairly satisfied” rather than ticking the alternative “neither satisfied or dissatisfied”, “fairly dissatisfied” or “very dissatisfied” boxes.
For me it’s just not good enough to pat yourself on the back too much because so many people are “fairly satisfied”. The Collins dictionary explains “you use ‘fairly’ instead of ‘very’ to add emphasis without making it sound too forceful”. I agree; if I tell you I’m “fairly satisfied” with the service you’ve given me, rather than being “very satisfied” it’s because I have reservations. I’ve long thought it would be better to headline the “very satisfieds” and make it a goal to turn the “fairlys” into “verys”. But this seems to get lost in the self congratulatory adulation that usually follows the report’s publication.
Anyway that aside, top chart ranking unsurprisingly goes to (local authority areas) Nottingham City and Nottinghamshire County which scored 95% and 94% ‘overall satisfaction’ respectively and bus companies in those areas scoring equally high with Nottingham City Transport on 95%, Nottingham Community Transport even higher on 96%, TrentBarton on 94% and Stagecoach in Nottinghamshire on 95%. Impressive.
Nottingham City Transport’s result is all the more impressive for being based on 1,608 questionnaires whereas Nottingham Community Transport only had 212 passengers surveyed as well as the more bespoke nature of the service they provide making for comparisons somewhat dubious. Stagecoach in Nottinghamshire was also quite a small sample size with just 289 passenger responses with TrentBarton on 405.
However, that 96% result for Nottingham Community Transport wasn’t the highest score. Oh no. Results for Go Ahead Group bus companies are separated down to individual brands in some places with the consequence the actual chart topper for ‘overall satisfaction’ this time round is ‘Oxford Bus Park and Ride’ scoring a mighty 97% (but only on 282 responses) – Oxford Bus more generally scored 91%.
Mention also of Salisbury Reds who had 290 passenger responses giving them a score of 96% including no passengers at all expressing any dissatisfaction – the other 4% were neither one nor the other.
After Nottingham City and County, next in line on the local authority chart displayed above are six areas on 93%: Bournemouth & Poole, Cornwall, Derbyshire, Kingston-upon-Hull, Oxfordshire and Swindon and five on 92%: County Durham, Merseyside, Portsmouth, Tees Valley and Tyne & Wear.
In the bus operator league table shown below other operators on 95% alongside Nottingham City Transport are morebus in Bournemouth & Poole and TrentBarton in Derby; while on 94% are Go North East Durham, Plymouth Citybus, Stagecoach in Merseyside and Halton, Tees Valley, Thames Travel, and Courtney Buses and on 93% are Go North East Tyne & Wear, Stagecoach in Devon, Hull and Swindon.
Adding all the company results together across the Groups gives Go-Ahead and Stagecoach both scoring a high 91% overall satisfaction with Arriva on 88%, National Express on 85% and First Bus on 84%. These results are all within 1% of last year’s outturn. Just looking at passengers who are ‘very satisfied’ (the dark green bars) Go-Ahead wins on 52% with Stagecoach on 49%, Arriva 47%, First Bus 42% and National Express on 40%.
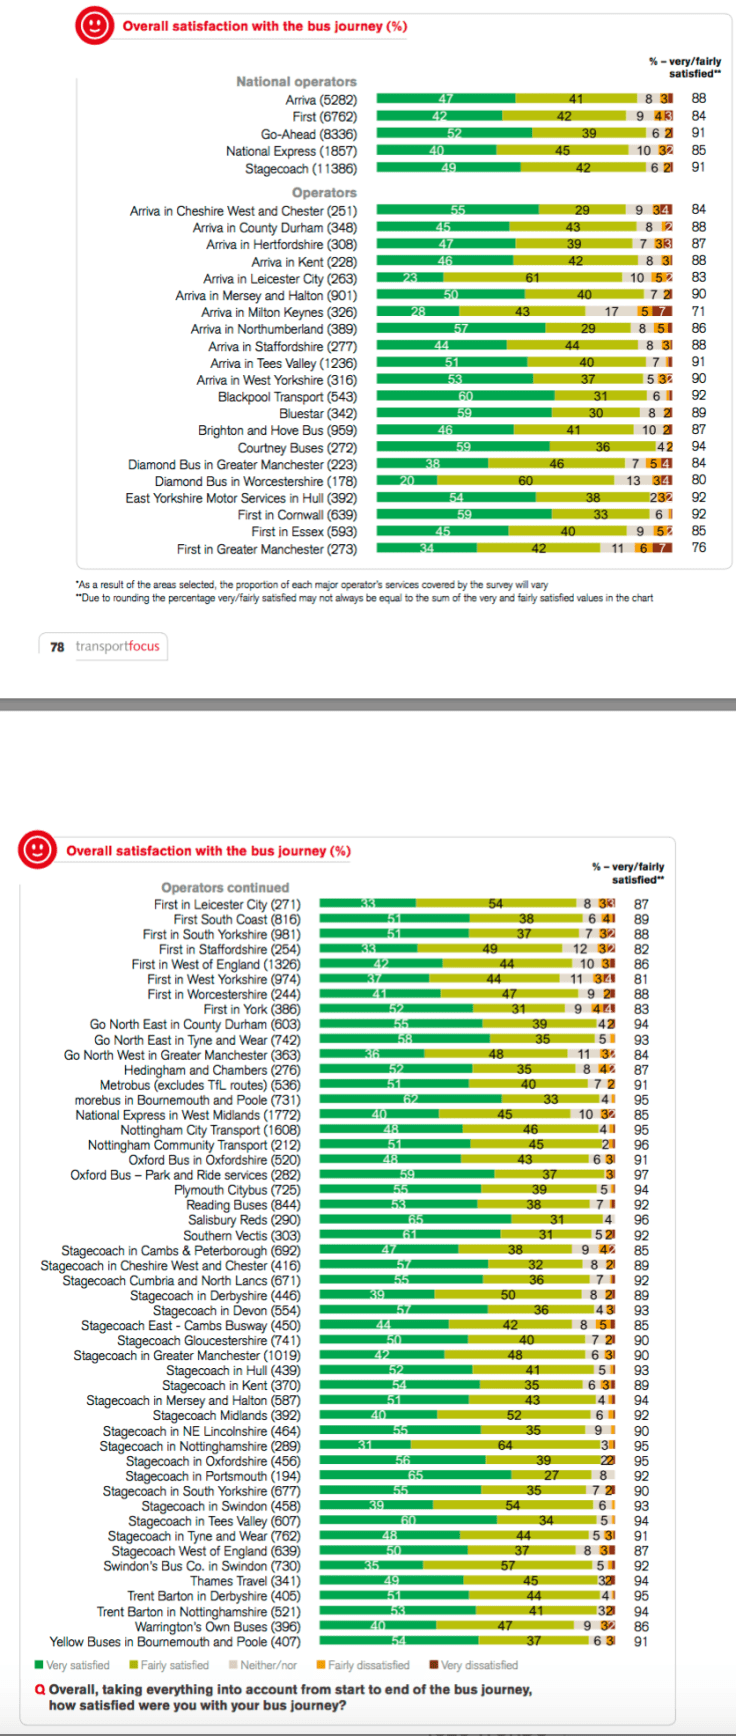
Individual bus companies with the most ‘very satisfied’ passengers at 65%, which I reckon is a very credible result are: Salisbury Reds and Stagecoach in Portsmouth. Not far behind are morebus on 62%. Companies with the least ‘very satisfied’ passengers are Diamond Bus in Worcestershire on 20% and Arriva in Leicester on 23%. However, both companies had the most ‘fairly satisfied’ passengers (60% and 61% respectively) aside from Stagecoach in Nottinghamshire on 64%.
I took a look at the results in Greater Manchester with interest, as it’s here Mayor Burnham reckons there’s so much wrong with buses he needs to take back control himself. A good sample size of 2,116 passengers took part across the TfGM area with an overall satisfaction of 87% with ‘very satisfied’ at 41% and ‘fairly satisfied’ at 46%. 8% couldn’t make their minds up leaving 4% ‘fairly dissatisfied’ and just 2% saying they are ‘very dissatisfied’ (rounding brings the total to 101%). Hardly a mandate for a wholesale change to the regulatory structure.
That 87% satisfaction came in ahead of fellow ‘PTEs’ West Midlands and West Yorkshire on 85% and was the same result as last year’s survey which was just ahead of the 2017 survey for Greater Manchester at 86% and even more improved on the 83% result in 2016. So satisfaction is improving. Interestingly comparing satisfaction with bus punctuality across the big conurbations shows Greater Manchester bottom of the ranking on 68% compared to West Midlands on 73% and West Yorkshire on 70%. South Yorkshire was on 72%, Merseyside on 77% and Tyne & Wear scored 78%. And remember its punctuality above all else passengers want as a priority and that’s often very much in the hands of the highway authority rather than the bus company. Indeed top of the factors affecting journey time according to passengers responding in Greater Manchester was “congestion and traffic jams” with 26% highlighting this.
I also looked at the 2,116 responses in Greater Manchester to see if there were significant differences between operators as well as comparing them to chart topping Nottingham City Transport. Stagecoach in Manchester had 1,019 questionnaires returned, Diamond Bus had 223, First Bus 273 and Go North West 363 which leaves a missing 238 which I was unable to find.
Compared to Nottingham City Transport’s overall satisfaction of 95%, Stagecoach scored best at 90% followed by Diamond Bus and Go North West both on 84% and First Bus on 76%. Scores for value for money satisfaction were Nottingham 78%; Stagecoach 63%, Diamond bus 62%, Go North West 61% and First Bus 58%.
Two key factors: Punctuality and Waiting time for the bus scored significantly differently with NCT on 81% and 82% whereas the Manchester operators scored as follows: Stagecoach 73% and 75%, Diamond Bus 55% and 63%, Go North West 69% and 70% and First Bus 56% and 62%. We all know how important punctuality is and it’s interesting to see the significant variations among the operators indicating perhaps some do more than others to mitigate the problems of congestion.
Looking at factors ‘on the bus’ (eg destination information, cleanliness, ease of boarding and alighting, availability and comfort of seats etc) there are also wide variations with NCT scoring in a range 85% to 93% across the factors whereas the Greater Manchester operators scored much less with Stagecoach doing best on 62% to 91% but Diamond Bus only 47% to 85%, Go North West 62% to 89% and First Bus 55% to 81%. Most variation came from satisfaction with ‘the information provided inside the bus’ where NCT scored 85%, whereas Stagecoach and Go North West scored 62%, Diamond Bus only 47% and First Bus 55%.
Finally aspects of the bus driver’s role and work brought satisfaction at NCT ranging between 84% and 95% with Stagecoach 70% to 92%, Diamond Bus 58% to 81%, Go North West 71% to 91% and First Bus 65% to 89%. Taking the most important of the attributes – helpfulness and attitude of the driver – saw NCT achieve 84%, Stagecoach 72%, Diamond Bus 58%, Go North West 71% and First Bus 65%. There’s a bit of a pattern emerging here of who the best and the not-the-best operators in Manchester are.
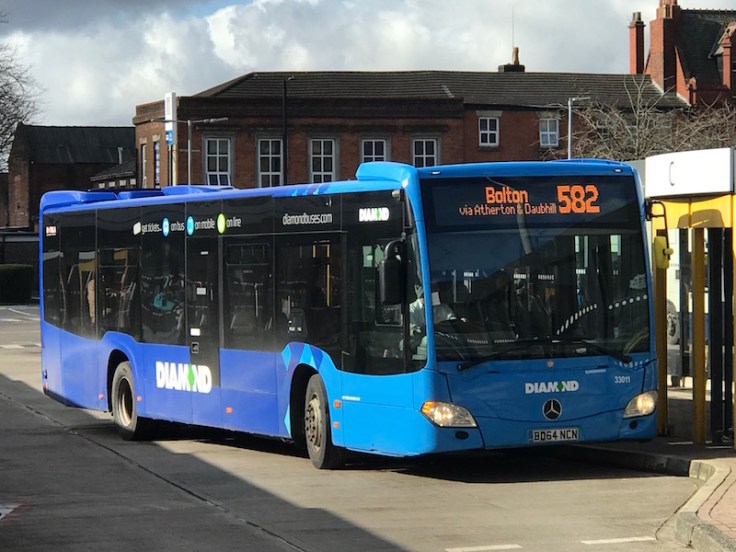
My conclusion from this brief analysis is there’s work to be done by all parties; TfGM to get to grips with congestion impacting punctuality and the bus companies with the way buses are presented and the attitude of the driver and particularly in the north of the conurbation – Diamond Bus and Go North West as successor companies to First Bus have their new reputations to deliver upon. Whereas only 3% of passengers expressed any dissatisfaction with driver attitude in Nottingham and 4% did so at Stagecoach, it was 8% at Go North West, 9% at First Bus and a high 11% did so at Diamond Bus. Quite a difference. Maybe those bus companies formerly part of First Bus in the north of the conurbation, and First Bus itself, need to take a trip over to Nottingham after lockdown and see how they do it.
Knowing how important the driver’s role is in delivering high satisfaction ratings I also took a look at the results for the helpfulness and attitude of the driver for each Company across the country and part of this latest survey. Top ranking companies with satisfaction higher than 90% on this key attribute were Stagecoach in Nottinghamshire on 95%, morebus on 93%, Trent Barton on 93% (Derbyshire) and 92% (Nottinghamshire), Salisbury Reds on 92% and Nottingham Community Transport on 91%. Bottom of the league were Diamond Bus on 58% (Worcestershire) and 64% (Greater Manchester), Arriva Milton Keynes on 64%, First Greater Manchester on 65%, National Express West Midlands on 66%, First Staffordshire on 67%, First West Yorkshire on 68%.
One final observation which often comes up when bus companies trumpet the positive results of these surveys is ‘what about people who don’t travel by bus because they’re so disatisfied?’ It’s true the survey doesn’t capture the views of non users, and it is of course very important to know why they don’t travel; but it is still a very positive story to see just how well those operators in the Premier League of Bus Companies are doing at satisfying the passengers who are travelling, and that’s both ‘very’ and ‘fairly’.
Roger French

We all know how important punctuality is and it’s interesting to see the significant variations among the operators indicating perhaps some do more than others to mitigate the problems of congestion.
With regards the comment about punctuality variations between Manchester and Nottingham Roger, it is perhaps the local authority who does more to mitigate the problem of congestion in Nottingham, rather than the operators in Manchester doing less.
The amount of effort that Nottingham, Nottinghamshire CCs have put into reducing car usage, working with the operators (sense a pattern here?!), and have been doing for some time, is totally at odds to the TfGM method of shouting loudly about how poor their operators are (who struggle through the congestion mostly caused by TfGM) and putting all their resource into trying to make a case for franchising, when better and quicker benefits could be realised.
LikeLiked by 1 person
So there are no buses at all in Wales or Norther Ireland? What are those big green and orange, or blue and grey things that go past the end of my road (and still at a rate of 5 every hour)?
LikeLike
Excellent analysis (as usual), thank you Roger.
Agree with D above, it’s just the same in West Yorkshire with Metro/WYCA as it is with TfGM. They both see London and want to copy it (eg massive subsidies yet no printed timetables and maps – tiny cuts financially but so important to bus users and tourists).
WYCA/Metro could not run a whelk store in Whitby, if their performance on bus infrastructure is anything to go by. 🙄
All bus companies and transport authorities should try to emulate Nottingham.
Simples 😀
LikeLike
Transport Focus surveys are, as far as I’m concerned, utterly worthless.
We see their people on railway stations and on trains, and for the entire duration our cleaners are filling bags with unwanted surveys which have been dumped just as soon as the Transport Focus people are out of sight. Their response rate must be less than 10%, of an already small sample.
That the bus and rail industries treat the results of massively flawed surveys with such reverence (at least when those results are PR-worthy) is just another example of those industries happily deluding themselves into believing they’re loved by their passengers.
LikeLike
I work(ed) doing travel surveys for TfL on most modes of travel. The contracts are very valuable for the market research company and a great effort is made to deliver results to delight the client. Then within the client there are managers trying to get even better scores from us to impress their Board of Directors. For example, a particular score on London Buses was coming in quite low – the survey question was then changed as was the way it was scored and the result was significantly better – however on the ground nothing had actually changed!
LikeLike
Couldn’t agree more than with “A Train Driver” regarding the expensive nonsense of surveys. On the old NatEx West Midlands 46, now the 52, which plunges down the back and very dark streets of former “Peaky Blinder” type territory in Birmingham en route to Perry Barr, the passengers were “very satisfied” at all times with the service, as most were travelling on “bent” tickets when only needing to be shown to the Driver. Along with many modern “cultures”, much of this marketing tripe has come from our well-meaning American Cousins and if Managers spent less time at their desks pouring over such rubbish, and more time out using their own services, they could right wrongs at a stroke. As one who uses buses throughout the UK, I could have told them the “good”, “bad” and “ugly” on the back of an envelope. It may be noted that the other bastion of control freaks (Nexus) in Tyne and Wear, as with Manchester, may be slightly put out that the public do not appear to agree with their assertions of a “terrible service”.
LikeLike
This survey never gives realistic results. Most people are dissatisfied with their bus services but some how the survey presents it as passengers being delighted with the services.. A lot of delusion here. It is rare in these type of satisfaction surveys to even get to 70% and that from companies have first class customer services and I would not by bus companies in that category by any means. Some of it my be down to the fact that in many areas 95% of passengers are concessionary pass holders fare paying passengers having been driven away by very high fares and very infrequent and very unreliable services that operate very limited hours Without change outside of the cities and lrge towns buses in my view dont have much of a future it is more a case of slow terminal decline
LikeLike